AWS 以 Amazon Bedrock AgentCore 建立可用於正式環境的 AI 智能體評估框架
Building trust in AI agents: A production-ready evaluation framework with Amazon Bedrock AgentCore
AWS Sales, Marketing, and Global Services(SMGS)團隊以 Amazon Bedrock AgentCore Evaluations 建立九階段評估框架,涵蓋 AI 智能體由開發到正式環境運作的完整生命週期。
文章把工具、單一智能體與多智能體協作納入九階段評估流程,並展示如何透過回歸門檻、線上監測及追蹤資料定位品質退化。
The North Star
Every organization racing to deploy AI agents faces the same reckoning: an agent that demos beautifully can quietly degrade in production, and by the time a human notices, the trust is already broken. Where traditional software fails loudly, agents fail softly. They return an answer that looks confident, reads fluently, and is wrong. When that answer drives a real business decision, the cost is not a broken feature. It’s a broken relationship with the user.
That’s the quality problem at its core. The challenge is therefore not building agents that work once, but proving they keep working, at scale, across every sub-agent, every workflow, and every release. The teams that win the agent era will be the ones who treat quality not as a final QA step but as the operating system of the agent itself: continuously measured, automatically defended, and improved with every interaction. In this post, we show how we built a continuous quality loop for production-ready agentic solutions at scale using Amazon Bedrock AgentCore.
Business problem
The solution uses Amazon Bedrock AgentCore and other AWS services for internal use, so sellers and sales leaders can ask business questions in plain English from Amazon Quick. Behind that single experience, several specialized sub-agents work together: the Performance Insights Agent for territory-scoped revenue and performance, the Customer Insights Agent for customer intelligence, the Data Insights Agent for text-to-SQL over foundational datasets, and direct dashboard access. Answers are scoped to each user’s territory and role-level security. Field teams use these answers to assist in planning account strategy, prepare for customer meetings, so the numbers must be right. The most damaging failure is not a crash. It’s a fluent, confident answer that is quietly wrong. Before launch, when we evaluated the Customer Insights Agent, we found exactly that:
- It reported $410.08 of a customer’s three-month revenue on a service as “$410.08 Million.”
- It reported Sales Revenue labeled as Sales Revenue excluding Adjustments.
- It offered an Annual Recurring Revenue estimate that appeared nowhere in the data.
- It presented its own calculations as sourced facts.
Through the different runs, monitoring stayed green. It told us the system had responded, not whether the answer was right.
Had these errors shipped uncaught, the field would have paid for them. A seller who repeats an inflated figure can lose credibility with the customer. This is exactly why we caught it before launch. The risk doesn’t end at launch: it grows with every new agent and every change to data, prompts, code, or models. It also grows without any release, because upstream pipelines refresh the data every week. Coordinated releases introduce a related risk: when a data change, a tool change, and a paired prompt update are meant to ship together but land apart, the system runs mismatched until all changes catch up. In one pre-production test, that mismatch window by itself dropped the pass rate from 78 percent to 38 percent. To catch failures like these, before every release and continuously in production, we need a framework that can show whether answers are grounded and correct, and trace each failure back to its root cause in the data, the prompt, or the agent’s code.
At AWS, the Sales, Marketing, and Global Services (SMGS) Operations team developed a production multi-agent system serving AWS Field Sales worldwide. It serves two distinct audiences. For field sales teams, it replaces hours of manual data analysis with on-demand, conversational intelligence, helping sellers understand the health of their business, surface risks and opportunities, and take action faster. For leadership, it powers business management cadences including Weekly Business Reviews (WBRs), surfacing the signals that matter across the portfolio without requiring manual report preparation. The same agentic system serves both the seller on the front line and the leader reviewing performance at scale.
The agentic system orchestrates a growing portfolio of specialized sub-agents, each owning a distinct capability domain. Among them: the Performance Insights Agent generates natural-language business intelligence narratives from complex sales data, turning raw metrics into actionable seller insights. The Customer Insights Agent assembles a 360-degree view of each customer by synthesizing signals across product usage, support history, contract status, and engagement data, helping sellers understand where a customer is in their journey and what they need next. The Data Insights Agent is a text-to-SQL agent that account teams use to query structured analytics data in plain English without writing a single line of SQL. These three agents are the ones referenced throughout the rest of this post.
Coordinating these agents reliably at scale made one thing clear: agentic quality wasn’t an operational concern to manage later. It was the prerequisite for operating. A single degraded sub-agent can silently corrupt every response downstream, and traditional monitoring won’t catch it. That reality made a full lifecycle evaluation framework not optional but necessary. AgentCore Evaluations, a capability of Amazon Bedrock AgentCore, is the connective tissue powering it, alongside Amazon Bedrock Guardrails (safety), Amazon CloudWatch (metrics, alarms, tracing), Amazon Simple Storage Service (Amazon S3) and Amazon Redshift (evaluation persistence), Amazon Quick (dashboards), and AWS Lambda (custom evaluators).
In this post, we share how we tackled the hardest operational challenges in running AI agents at enterprise scale, and how Amazon Bedrock AgentCore Evaluations became the backbone of agent quality. Specifically, we cover:
- Agents play by different rules – Why agents demand a different operational discipline, and why traditional monitoring (latency, error rates, uptime) leaves you blind to the failures that matter most.
- A map for the whole journey – The nine-stage evaluation framework we built on AgentCore Evaluations, covering every phase of the agent development lifecycle from first commit to production.
- From theory to practice – Concrete patterns (continuous integration and continuous delivery (CI/CD) regression gates, canary scoring, drift detection, and automated feedback loops) and exactly how AgentCore Evaluations powers each one.
- Metrics that actually matter – The measurable impact on deployment confidence, regression prevention, and iteration speed across our agent portfolio.
Why agents need a structured evaluation framework
Traditional software is deterministic: the same input produces the same output. Machine learning (ML) models introduced probabilistic outputs, and MLOps emerged to manage their training, versioning, monitoring, and re-training. AI agents add a third layer of operational complexity: autonomous, multi-step reasoning, where the question shifts from “did something break?” to “is the agent making sound decisions across its entire reasoning chain?”
Agents inherit the hard problems of both predecessors, and introduce some new ones. They’re non-deterministic, following different reasoning paths for identical inputs. They make cascading decisions across routing, tool selection, and synthesis, where a single step can fail quietly and corrupt everything downstream. Most critically, they degrade silently: latency stays low, error rates stay flat, yet the quality of agent response erodes, because the agent is still responding. It is just responding wrong.
Agent evaluation is the practice of catching exactly that. It spans five dimensions: safety (is it behaving within defined boundaries?), quality (is the agent producing correct, coherent, grounded responses?), performance (is it fast and reliable enough?), cost (is it running efficiently at scale?), and operational control (can we detect, diagnose, and remediate issues quickly?). A mature evaluation practice addresses five continuously, throughout the full agent lifecycle.
In this post, we share how we operationalize five evaluation dimensions across a production multi-agent system. Safety and security is our first priority. No agent ships, and no agent keeps running, if it can’t meet its safety bar. Quality gets the most space in this post because it’s the hardest of the five to get right and benefits most from a dedicated framework, but it doesn’t outrank safety. Performance, cost, and operational control are woven into every stage of the lifecycle alongside both. Critically, this framework applies at every level of the agent hierarchy. At the tool level, each capability (a customer disambiguation tool, graph retrieval tool) has its own evaluation contract. At the agent level, each sub-agent is evaluated end-to-end. At the multi-agent level, orchestration paths are evaluated for coherence, correct routing, and synthesis accuracy across agent boundaries.
The nine stages apply at three levels simultaneously, and this hierarchy is not specific to this product. It’s the right mental model when we build or integrate new production agents. Most teams start by evaluating at the agent level and stop there. But agent-level quality is only as good as the tools it relies on, and multi-agent systems introduce a third failure surface that neither level can see alone. A robust evaluation practice covers three, with each level running its own golden set, its own evaluators, and its own promotion criteria through the nine stages.
The agent evaluation framework: nine stages, one closed loop
These nine stages trace the agent lifecycle from first commit to live production, and each one answers a question teams face as their agents mature.
The agent lifecycle and the nine common questions
Every team building production agents encounters the following questions as their agent matures:
Stage 1: The Foundation: “What does good look like?”
Stage 2: The Experiment: “Which version is better?”
Stage 3: The Merge (CI): “Did I break something?”
Stage 4: The Gate (CD): “Is it safe for production?”
Stage 5: The Canary: “Did something silently break?”
Stage 6: The Adversary: “What if someone tries to break it?”
Stage 7: The Drift: “Is quality drifting in live?”
Stage 8: The Pulse: “How do we know it’s working right now?”
Stage 9: The Feedback Loop: “How does it get better automatically?”
We build one framework for every stage of the agent lifecycle using AgentCore Evaluations. The nine stages are not separate tools stitched together after the fact. They’re nine points on a single, continuous evaluation surface, powered by AgentCore Evaluations from first commit to production response, as shown in Figure 1.
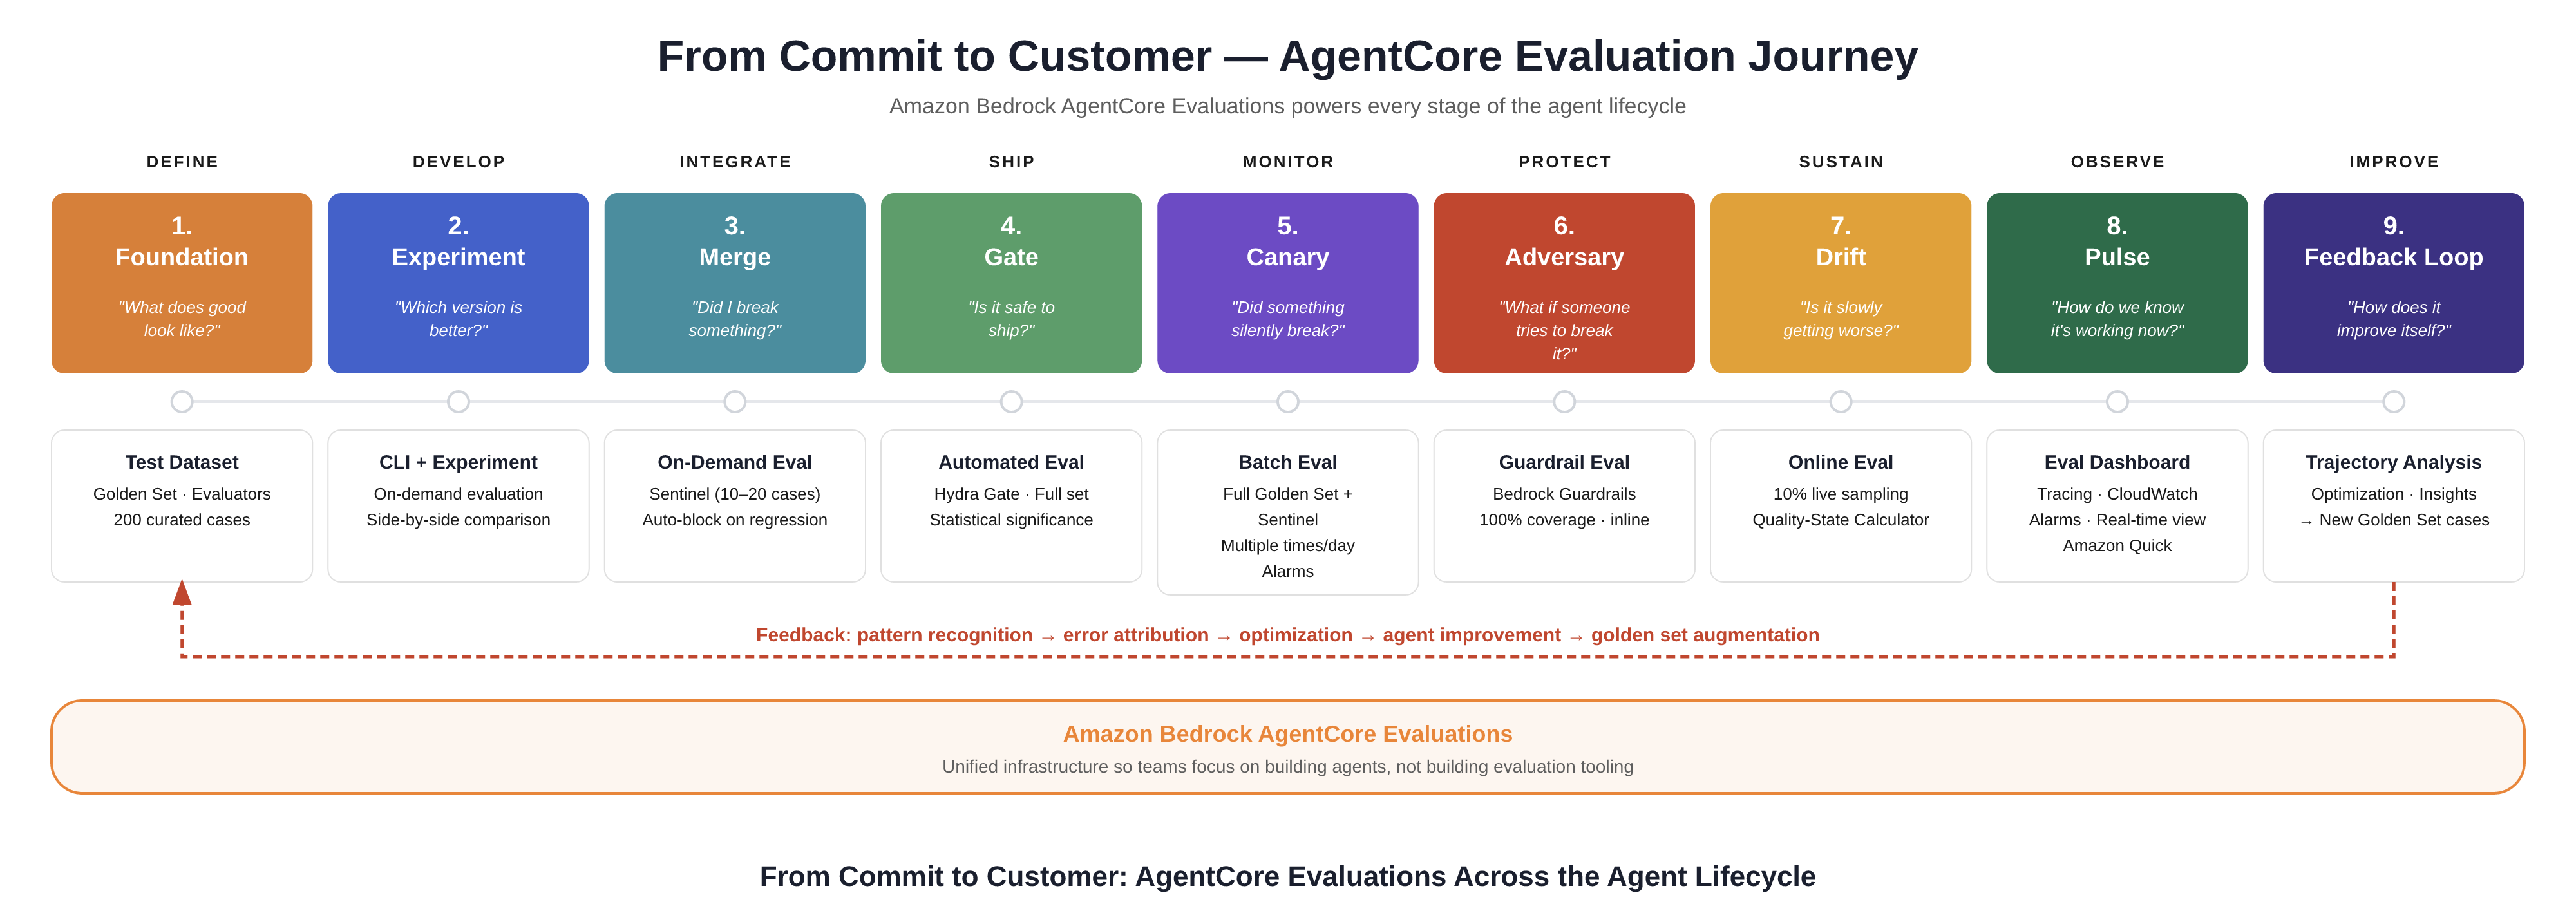
Figure 1: The nine-stage AgentCore Evaluations journey, from Define through Improve
Here’s how we tackle each one: the pattern that works, the AgentCore services behind it, and what it looks like running in production, shown in system design in Figure 2.

Figure 2: System design of the AgentCore evaluation framework
Stage 1: The Foundation. Define quality
The foundation of evaluating an agent isn’t about choosing the right tools. It’s about asking the right question: what does success look like for this agent, and how do we know when it is failing? The answer must come from the customer, not from the model. This is an iterative process. Our definition of success has sharpened as we observe what the agent actually does in production. Everything defined here (failure thresholds, evaluator stack, golden set, safety rules, latency budgets, and cost targets) is the contract every subsequent stage enforces. If Stage 1 is vague, every downstream gate is guessing.
Stage 1.1: Define your business metrics first. Start by asking what the agent exists to deliver. The two end user personas define success differently:
- For sellers, success means walking into a customer conversation with accurate, current intelligence at the right detail level and at the right time.
- For leadership, success means reliable weekly and cross-business review inputs without lengthy manual preparation. These are business outcomes, not model properties.
Stage 1.2: Translate those business metrics into evaluation metrics. For each outcome, identify the signal that confirms the agent delivered it. Each signal becomes a tracked metric with an explicit threshold and an alarm condition. Accurate account intelligence maps to entity resolution accuracy and grounding rate. Seller trust maps to faithfulness and hallucination rate. Seller action maps to helpfulness and scope adherence. Leadership review reliability maps to accuracy pass rate and response coverage. This translation must cover five dimensions: alongside quality thresholds, define safety guardrail policies, set p50, p90, and p99 latency targets per tool and per agent, establish cost-per-query budgets, and define the service level agreements (SLAs) that determine when an alarm fires and which runbook it triggers.
For accuracy specifically, because the solution directly informs revenue decisions, renewal strategies, and executive reviews, the bar is high. A confidently wrong answer does not only waste a seller’s time. It leads to a wrong decision in a real business moment. We define six failure types derived from real production errors, any one of which marks a response as inaccurate:
- Metric swap: correct customer and period, wrong metric returned. Tracked as occurrences per 100 responses.
- Wrong period: data from one time window is labeled as another, for example a year-over-year (YoY) figure presented to the seller as month-over-month (MoM), or the reverse. Tracked as % citing the correct window.
- Wrong entity: conflated account names or subsidiaries. Tracked as entity resolution accuracy %.
- Pure hallucination: ungrounded figures with no traceable source. Tracked as grounding rate %.
- Wrong symbols: correct metric, wrong currency or unit symbol. Tracked as scope adherence rate %.
- Unauthorized calculation: unsanctioned derived figures not present in the source data. Tracked as occurrences per 100 responses.
The overall accuracy pass rate is the headline metric. Per-dimension tracking is what makes it actionable. Beyond accuracy, we also track Response relevance, Faithfulness, Helpfulness, Instruction Following,Tool Selection Accuracy. A correct answer buried in three paragraphs, or arriving too late, has also failed the seller.
Stage 1.3: Build an evaluator stack that reflects those metrics. No single evaluator type covers the various failure modes possible. We combine four types:
- AgentCore built-in evaluators for broad baseline coverage. Relevance, faithfulness, and helpfulness map directly to evaluation templates available natively in AgentCore Evaluations.
- Customized evaluators, one per failure type in our taxonomy: a metric swap evaluator, a wrong period evaluator, a wrong customer evaluator, a pure hallucination evaluator, a wrong symbols evaluator, and an unauthorized calculation evaluator. None of the six are covered by native templates. They’re domain-specific signals we built on top of the AgentCore framework. Knowing upfront which metrics a native template already covers, and which require a customized evaluator, is itself part of the design decision.
- Third-party evaluators, we deployed the managed evaluators from third-party open source libraries DeepEval and AutoEval.
- Deterministic evaluators for ground truth checks where the correct answer is known exactly, such as revenue, renewal date, and contract status.
Where reasoning quality and helpfulness have no single correct answer, we use LLM-as-judge rubrics instead, with built-in rubrics for relevance, faithfulness, and helpfulness plus support for fully custom rubrics. AgentCore Evaluations provides both ground truth and LLM-as-judge evaluation natively, which is what let us stand up both evaluation paths without building either scoring engine ourselves. Deterministic gives precision on facts. LLM-as-judge gives breadth on reasoning.
Stage 1.4: Build a golden set to exercise your evaluation metrics. At the tool level, each critical tool has its own deterministic ground truth pairs: customer identification must resolve to the exact canonical entity or fail. At the agent level, topic analysis on real user queries produces a dataset across four question types (comprehensive, reporting, reasoning, and ambiguous), each requiring a different evaluation strategy, revisited monthly. At the multi-agent level, end-to-end orchestration scenarios catch errors that only emerge when agents interact. The golden set is not only a quality dataset. It also includes safety test cases, latency benchmark cases, and cost reference cases, so Stages 3 and 4 can check five dimensions against the same curated dataset.
The golden set is a living document, built from three sources. Production-derived cases are sampled from real seller and leadership queries, including the low-scoring live sessions promoted in Stage 7. Failure-derived cases come from every regression caught in staging or production, including the sentinel cases promoted in Stage 3 and the permanent regression guards promoted in Stage 9. Synthetic edge cases are deliberately constructed to guarantee coverage of scenarios we know matter but can’t wait to encounter in the wild, such as the four question types above and the parent-subsidiary and ticker-symbol disambiguation cases in Stage 4. The set is version-controlled, reviewed, and continuously extended across three sources.
Stage 2: The Experiment. Know which version wins
Every change (a prompt update, a new tool, a model upgrade, a dataset refresh) raises the same question: is this version actually better? In a system serving the AWS field at global scale, intuition isn’t an acceptable answer.
Before a change merges, we run an AgentCore On-Demand Evaluation, scored against the same golden set with the same evaluator suite. The development team uses the quality, latency, cost metrics, and context token, to curate downstream comparisons which is evaluated across five dimensions simultaneously, as shown side by side in Figure 3. A model that improves accuracy by 5 percent but doubles latency and triples cost doesn’t automatically win.
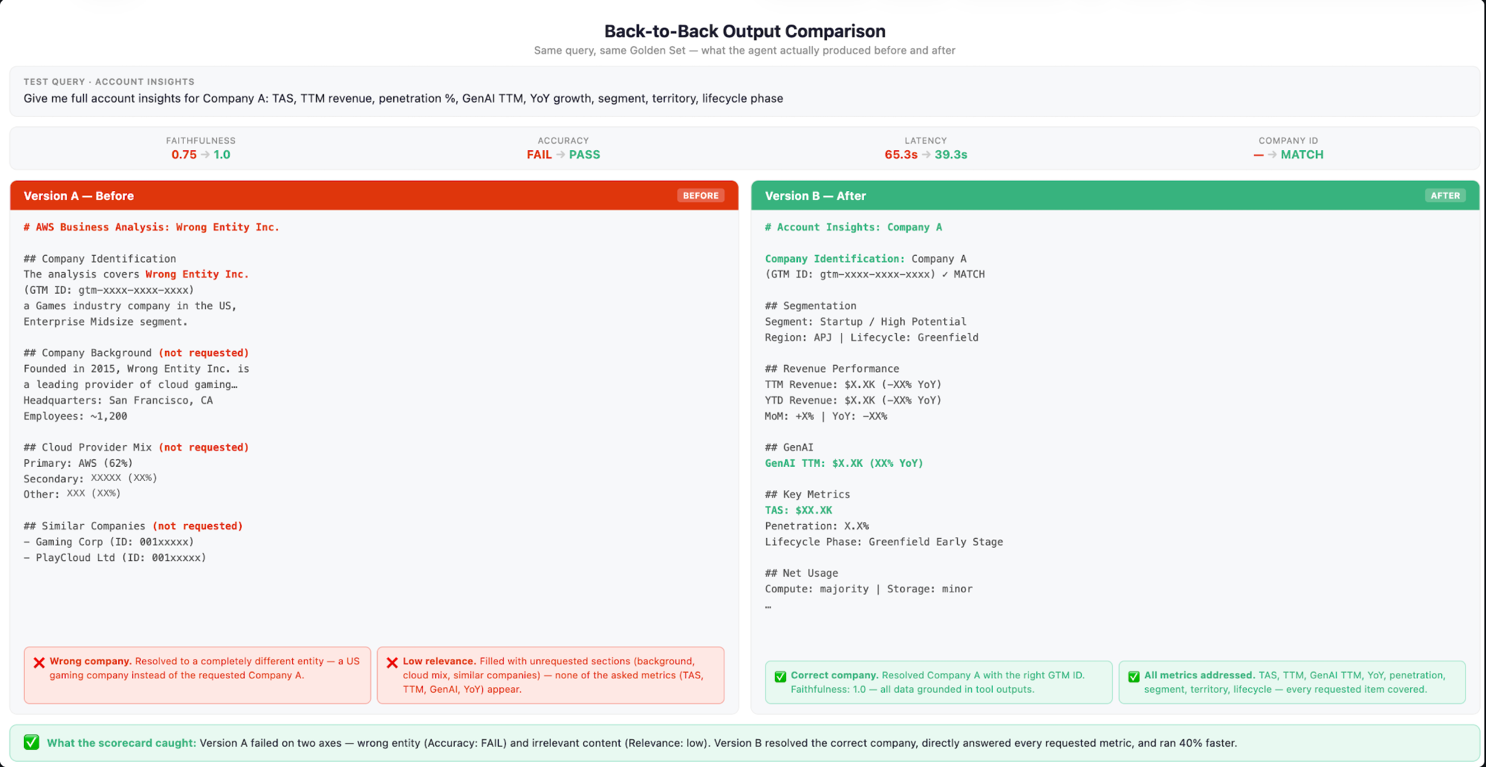
Figure 3: Side-by-side comparison of two candidate agent responses in an AgentCore On-Demand Evaluation across quality, latency, and cost. The numbers and values in the figure are illustrative.
We track quality as a comprehensive scorecard, not one single number. A pass rate alone doesn’t tell you enough. Each eval run produces a full breakdown across every failure category in our taxonomy: not just whether quality improved, but where and why, as captured in the scorecard in Figure 4. Every evaluation is also fully recorded: inputs, outputs, retrieved context, scores and evaluation reasons are stored in S3 and our data lake, giving us a persistent observability layer to trace failure back to its root cause: what the agent saw, what it generated, and why it went wrong. Over three months of targeted iteration, this scorecard drove pass rate from 93 percent to a stable 96 percent: pure hallucinations dropped from 138 to under 52 per 10,000 responses, unauthorized calculations fell from 59 to under 44, confirming that retrieval was sound and the gains came from generation fixes. Without the per-category breakdown and the detailed trace data behind it, we would have been iterating blind.
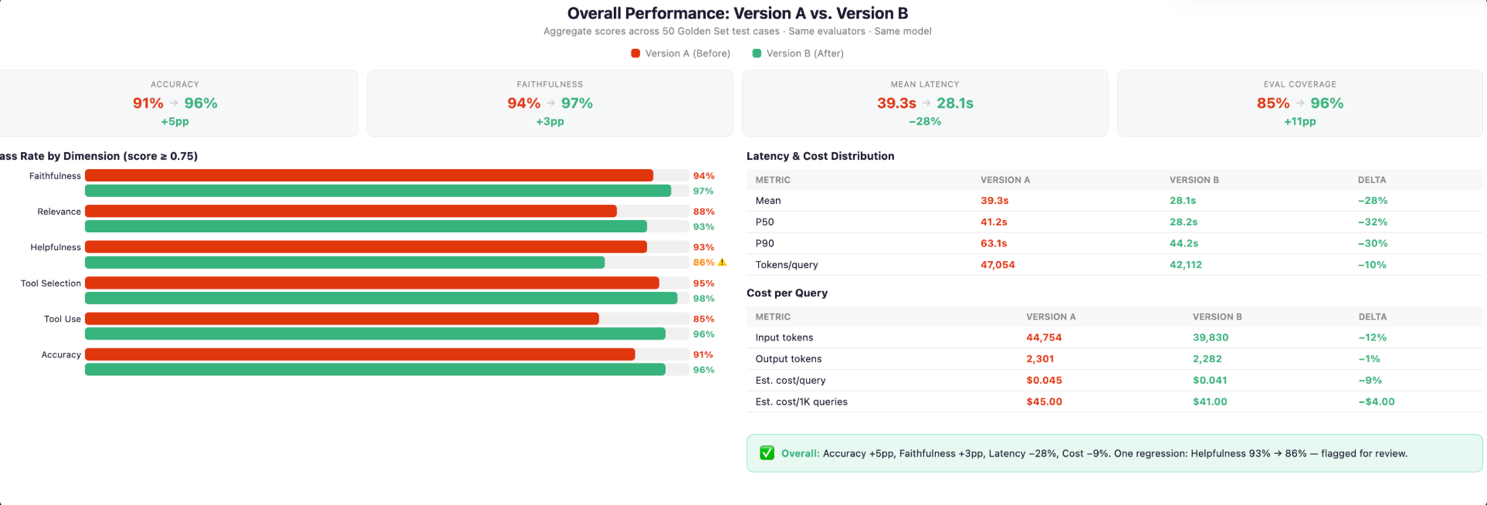
Figure 4: Evaluation scorecard with per-category failure breakdown and pass-rate trend. The numbers and values in the figure are illustrative.
Stage 3: The Merge (CI). Prevent regression at merge time
Stage 3 is a pre-production gate. It runs in the staging environment, triggered by code and configuration changes, and its job is to block a bad change before it ever reaches production. If Stage 3 catches a regression, nothing ships.
Engineers or scientists change the system in many ways: the prompt, the underlying data, the tools, or the model. The change looks clean locally, tests pass, but a prompt that improves responses for technology accounts could silently degrade responses for financial services accounts. Without an automated gate, this ships.
Our CI evaluation is triggered automatically on every staging deployment using AgentCore On-Demand Evaluation. Engineers do not need to remember to run an evaluation. No deployment can silently skip the gate. The run completes in minutes because it evaluates only the sentinel set, not the full golden set. Speed is intentional: the sentinel is narrow enough to run on every deployment but representative enough to catch the failures that matter most.
The sentinel set is a curated selection of the highest-risk scenarios across five dimensions. Quality regressions beyond tolerance block the deployment. A safety boundary violation blocks just as hard. A change that doubles p90 latency does not proceed without a deliberate decision. Token cost spikes are flagged before they compound at scale. Every sentinel run publishes its scores to CloudWatch as custom metrics alongside quality scores, latency, cost per query, and safety pass rate are all emitted after every run, and CloudWatch alarms are configured to fire if any metric breaches its Stage 1 threshold. Every run is also logged and stored, feeding the audit trail Stage 8 and Stage 9 rely on. We maintain a separate sentinel at each level: tool, agent, and multi-agent. A change that improves agent-level quality but degrades a critical tool still blocks. The sentinel is reviewed monthly, and a regression that slips through to production is immediately promoted into a permanent case so it doesn’t reach users twice.
One example of what this catches. After a data normalization update, a disambiguation tool started returning unresolved entities for a subset of account name formats. The agent, receiving an unresolved entity, responded with a best-guess match, returning real data for the wrong customer. Our tool-level sentinel includes exactly this class of edge case: the entity resolution ground truth check failed for the affected account name formats, and the deployment was blocked automatically. The change never reached production.
Stage 4: The Gate (CD). Ship with quantitative confidence
The sentinel covers 15 cases. Production covers tens of thousands of query patterns across hundreds of account types, geographies, and seller segments. Clearing the sentinel is necessary. It is not sufficient.
Before a candidate ships, we run an AgentCore On-Demand Evaluation against the full golden set across the evaluator dimensions. We call this the Quality Gate. It replaces “it seems fine” with a quantitative shipping decision.
Sandboxed execution and tool mocking. Think of it as a replay, not a live call. Ahead of time, we freeze a known, versioned dataset of correct tool behavior. Every tool call the candidate makes during the gate is intercepted and answered from that frozen dataset instead of a real system. We build that frozen dataset in two steps. First, we test each tool on its own: we send it a held-out set of inputs from our golden set where the correct answer is already known, and score what it actually returns against that known answer. This tells us whether the tool itself works (entity resolution, retrieval, SQL generation) before the agent is even involved. Second, after a tool’s responses are confirmed correct, we freeze those same validated answers into the replay dataset the agent sees during gate evaluation. That means the agent is tested purely on its own reasoning, not on live tool speed or availability, and because every candidate replays from the same frozen dataset, any score difference head-to-head is about the agent, not tool variance.
Aggregated end-to-end scoring. The gate also runs a holistic pass: the full candidate agent answers 200 held-out questions end-to-end, scored by an LLM-as-judge rubric across all evaluator dimensions. Any one of three conditions shuts the gate automatically: the aggregate score regresses against the candidate’s own prior run, it fails to beat the current production baseline, or more than a defined percentage of the 200 questions falls below the per-question threshold. A candidate must clear all three, which catches what a simple average can hide: a model that improves the mean while quietly failing a larger share of individual questions doesn’t pass.
One example of what this catches. This is where mocking tests the agent’s own reasoning, not just the tools underneath it. Our golden set includes a hierarchy mismatch case: the Customer Insights Agent and Data Insights Agent return different, individually correct revenue figures for the same customer, one scoped to the parent account, the other to a subsidiary. Neither number is wrong. The case tests whether the agent infers the right scope from the query’s semantics and the requester’s persona (a seller likely wants the subsidiary, whereas a leadership query likely wants the parent rollup), rather than defaulting, averaging, or asking the seller to disambiguate. The candidate failed, returning the parent-level figure for a subsidiary-scoped question. The golden set’s ground truth for this case specifies which scope the question expects, so the Quality Gate flagged the mismatch immediately: not a wrong number, but the right number for the wrong scope.
Stage 5: The Canary. Catch silent post-deploy failures
Stage 5 is a post-production monitor. It runs continuously in the production environment against live traffic and synthetic evaluation cases, and its job is to catch issues that no code change triggered and that Stage 3 therefore didn’t see. Stage 3 guards against what engineers change. Stage 5 guards against everything else like upstream data shifts, evolving model behavior, changes in third-party dependencies, or other conditions such as increased latency or shifting traffic patterns that only manifest under real-world load.
The product operates against a data estate fed by thousands of upstream schemas and data pipelines. On a given day, dozens of those pipelines refresh without triggering a deployment or CI gate. The agent code is unchanged, the model is unchanged, but the data it reasons over has changed, and quality can degrade silently as a result. We learned this the hard way: an upstream pipeline refreshed with a schema change, the agent started citing data from the wrong time window, and the first signal came through a seller inquiry rather than an automated alert. Stage 5 is how we catch this in the first 30-minute evaluation window instead.
We run AgentCore Batch Evaluation on two complementary schedules, and the choice of cadence was deliberate.
We settled on 30-minute cycles after learning from both directions: 15 minutes generated too many false alarms; 60 minutes let two hours pass before a real degradation registered. We call each 30-minute cycle an evaluation window. Thirty minutes catches a real trend within 90 minutes (three consecutive windows) while filtering out single-query noise. Each window scores a round-robin selection across the golden set, giving full coverage in 24 hours.
Thresholds are deliberately lower than CI/CD gates. A single window failure is an ops signal, not an incident. We only page oncall after three consecutive windows breach threshold. We learned this rule the hard way: the first month we used a single-window threshold, oncall stopped trusting the system entirely. Once per day, the full golden set runs at gate thresholds as the authoritative daily scorecard. The 30-minute windows surface the trend. The daily run confirms it and cuts a ticket.
Every run publishes to CloudWatch (accuracy, hallucination rates, grounding rate, latency, and cost), with alarm logic that distinguishes between the two cadences. The canary runs at three levels: tool-level scores surface a degraded retrieval tool before it corrupts agent-level responses.
Another example of what this catches. After an upstream index refresh, a retrieval tool began returning loosely relevant chunks instead of the precise context needed to answer the query. Latency was nominal. Error rate was zero. The agent kept producing fluent, confident responses by reasoning over weakly grounded context, producing answers that looked correct but cited the wrong figures. No infra alarm fired. The canary caught it in the first 30-minute window: grounding rate and retrieval precision dropped across the tool-level sentinel, triggering a CloudWatch alarm before sellers acted on the degraded answers. The low evaluator score flagged the exact trace responsible. From there, the on-call engineer opened that trace in AgentCore and traced the degraded context back to the retrieval tool in minutes.
Stage 6: The Adversary. Protect against misuse
Not every bad output comes from a degraded model. Queries crafted to extract unauthorized account data, and prompt injections embedded in retrieved documents, are predictable patterns in a system serving thousands of users on sensitive business data.
Safety isn’t a stage. It runs through all nine stages. We apply Amazon Bedrock Guardrails at two points in every interaction. At input, we validate query scope and screen for prompt injection. At output, we verify that no sensitive data is surfaced to unauthorized users and that the agent has not been manipulated into a policy violation. These checks run on 100 percent of traffic, synchronously, before a response reaches the user.
We configure two guardrail layers, each covering a distinct threat class:
Content filters detect and block harmful or inappropriate content in both inputs and outputs. We enforce filters across categories including VIOLENCE, HATE, SEXUAL, MISCONDUCT, and INSULTS. A request or response that triggers these filters is blocked before it reaches the seller or is surfaced to the user.
Prompt security filters protect the agent from adversarial manipulation under a single PROMPT_ATTACK guardrail category, covering three sub-types: JAILBREAK (attempts to override the agent’s system instructions or bypass its operational boundaries), PROMPT_INJECTION (unintended instructions embedded in retrieved documents, tool outputs, or user queries), and PROMPT_LEAKAGE (attempts to extract the system prompt or internal configuration). In a multi-agent system that uses Retrieval Augmented Generation (RAG), prompt injection through retrieved content is a real risk. An unintended document in a seller’s account data could attempt to redirect the agent’s behavior mid-reasoning.
Safety rules are defined at Stage 1, checked for regressions at Stages 3 and 4, and enforced continuously in production.
Stage 7: The Drift. Sustain quality and validate with live traffic
Quality degrades from multiple directions: upstream data changes without triggering a deployment, models grow stale, and users push boundaries with queries no golden set fully anticipates. Stage 7 detects it before sellers do, and validates candidates against real user traffic before full rollout.
Drift detection. Using AgentCore Online Evaluation, we sample 10 percent of live traffic continuously through the different evaluators defined at Stage 1, so the drift is immediately visible as a deviation from the baselines established offline. Scores feed into a Quality-State Calculator monitoring quality, latency, and cost in the same window.
One production example. Our golden set for customer identification was built from synthetic edge cases: name variations, subsidiary lookups, abbreviations. It performed well offline. But in live traffic, sellers queried with stock ticker symbols (“what’s going on with AMZN?”), shorthand names, and typos the synthetic cases did not exercise. The Quality-State Calculator surfaced the drift across three consecutive 30-minute windows: 98 percent at 1:30am, 81 percent at 2:00am, 80 percent at 2:30am. CloudWatch paged oncall when the rolling threshold was crossed. The on-call engineer queried the agent: “What happened to customer identification accuracy between 1am and 3am?” and received a trend summary pinpointing ticker symbol lookups and shorthand names as the failure driver. The agent’s trace made the root cause immediately visible. The fix: expand the golden set with the low-scoring live sessions, and update the disambiguation tool to normalize input formats before resolution. Accuracy recovered to baseline within the next evaluation cycle.
Live traffic feeds two continuous improvement loops: low-scoring sessions are promoted into the golden set as new edge cases, and clusters of low-scoring traces inform prompt revisions, tool updates, and routing adjustments.
A/B testing: After a candidate clears a quality gate, AgentCore Gateway, a capability of Amazon Bedrock AgentCore, routes a slice of real traffic between current and candidate agents. On-demand confirms no regression on known cases. Online confirms it holds up against the long-tail inputs and novel phrasings only real users produce. A candidate must win or draw across all evaluator dimensions before full rollout.
Stage 8: The Pulse. Real-time quality visibility
A single call to the agent might touch three sub-agents, five tools, and two retrieval paths. When a quality alarm fires, “something in the agent pipeline” is not a runbook. Stage 8 is where signals from Stages 5, 6, and 7 converge into an observability layer with enough resolution to act.
AgentCore Observability, a capability of Amazon Bedrock AgentCore, is the foundation. For agents hosted on the AgentCore runtime, a capability of Amazon Bedrock AgentCore, every execution is instrumented automatically through OpenTelemetry, emitting structured telemetry for every reasoning step: tools called, order, inputs and outputs, latency, and token consumption, published directly to CloudWatch as custom metrics and logs, after CloudWatch Transaction Search is enabled (a one-time setup step). Evaluator scores are a separate pipeline: they come from evaluation configs, not from execution instrumentation, and land in their own CloudWatch log group. Every evaluation run also persists its full outputs to S3 and our data lake, feeding two dashboards:
- A conversational dashboard to query evaluation and observability results.
- An Amazon Quick dashboard for trend analysis, scorecard tracking, and cross-agent comparisons across the full history.
Role-appropriate views sit on top. Oncall engineers get a trace-first view: one click from a CloudWatch alarm to the AgentCore Observability trace that triggered it. The trace shows every tool called, in what order, with latency per step, token consumption, cost, and the full reasoning context: everything needed to go from “alarm fired” to “root cause identified” without opening a second tool, as shown in Figure 5.
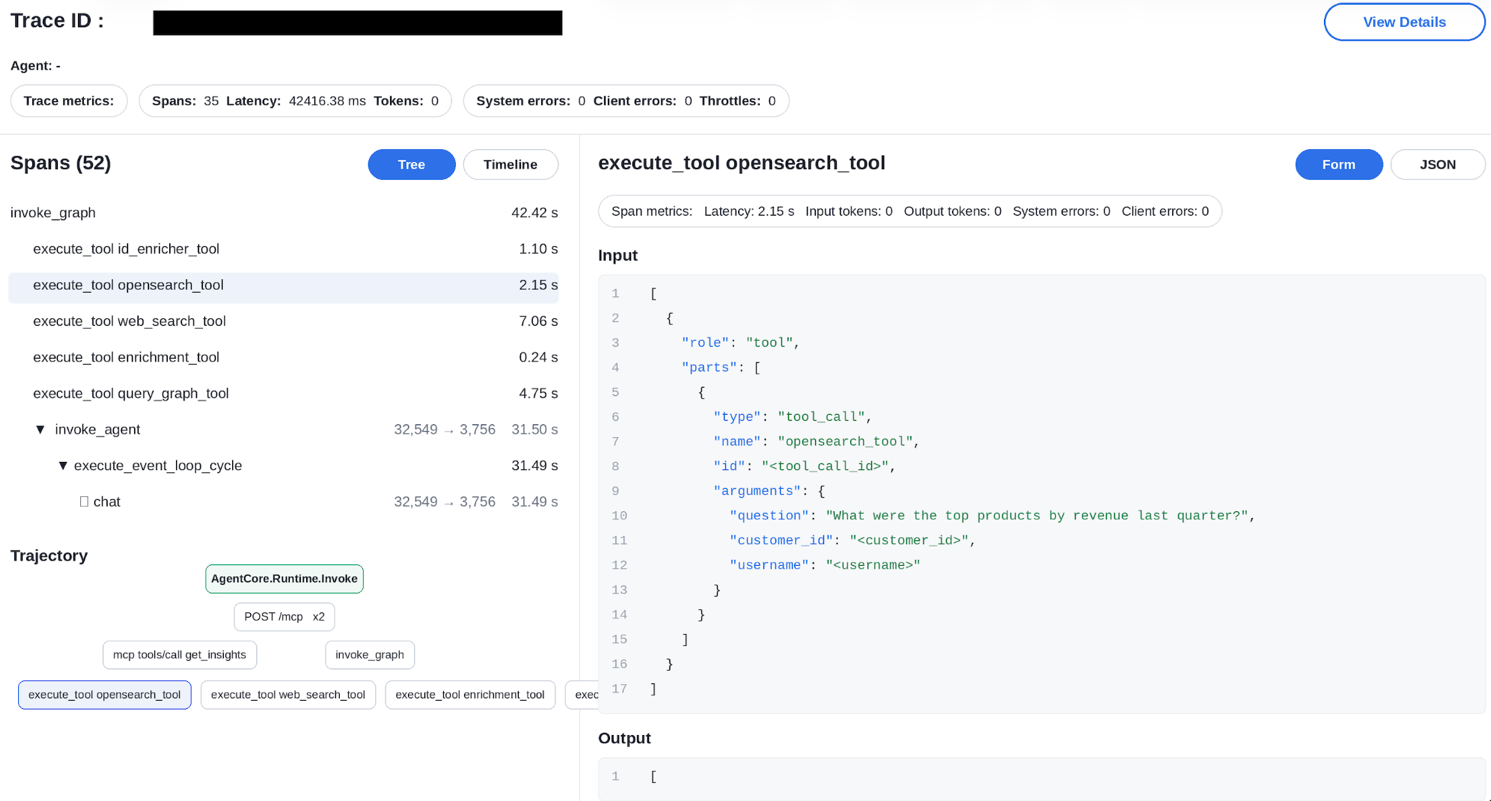
Figure 5: AgentCore execution trace for the Customer Insights Agent, showing the span tree, trajectory, and span-level metrics. The numbers and values in the figure are illustrative.
Product managers get Amazon Quick trend dashboards: quality scores by sub-agent and feature, release-over-release. Leadership gets a single-page health summary aligned to weekly and cross-business reviews across all five dimensions, a one-minute spot check that answers “how are our agents performing?”
Figure 6 shows the top-line view of our weekly evaluation dashboard: one combined pass rate drawn from both custom evaluators and AgentCore built-in evaluators, alongside latency, for the week’s run. The numbers and values in the figure are illustrative.
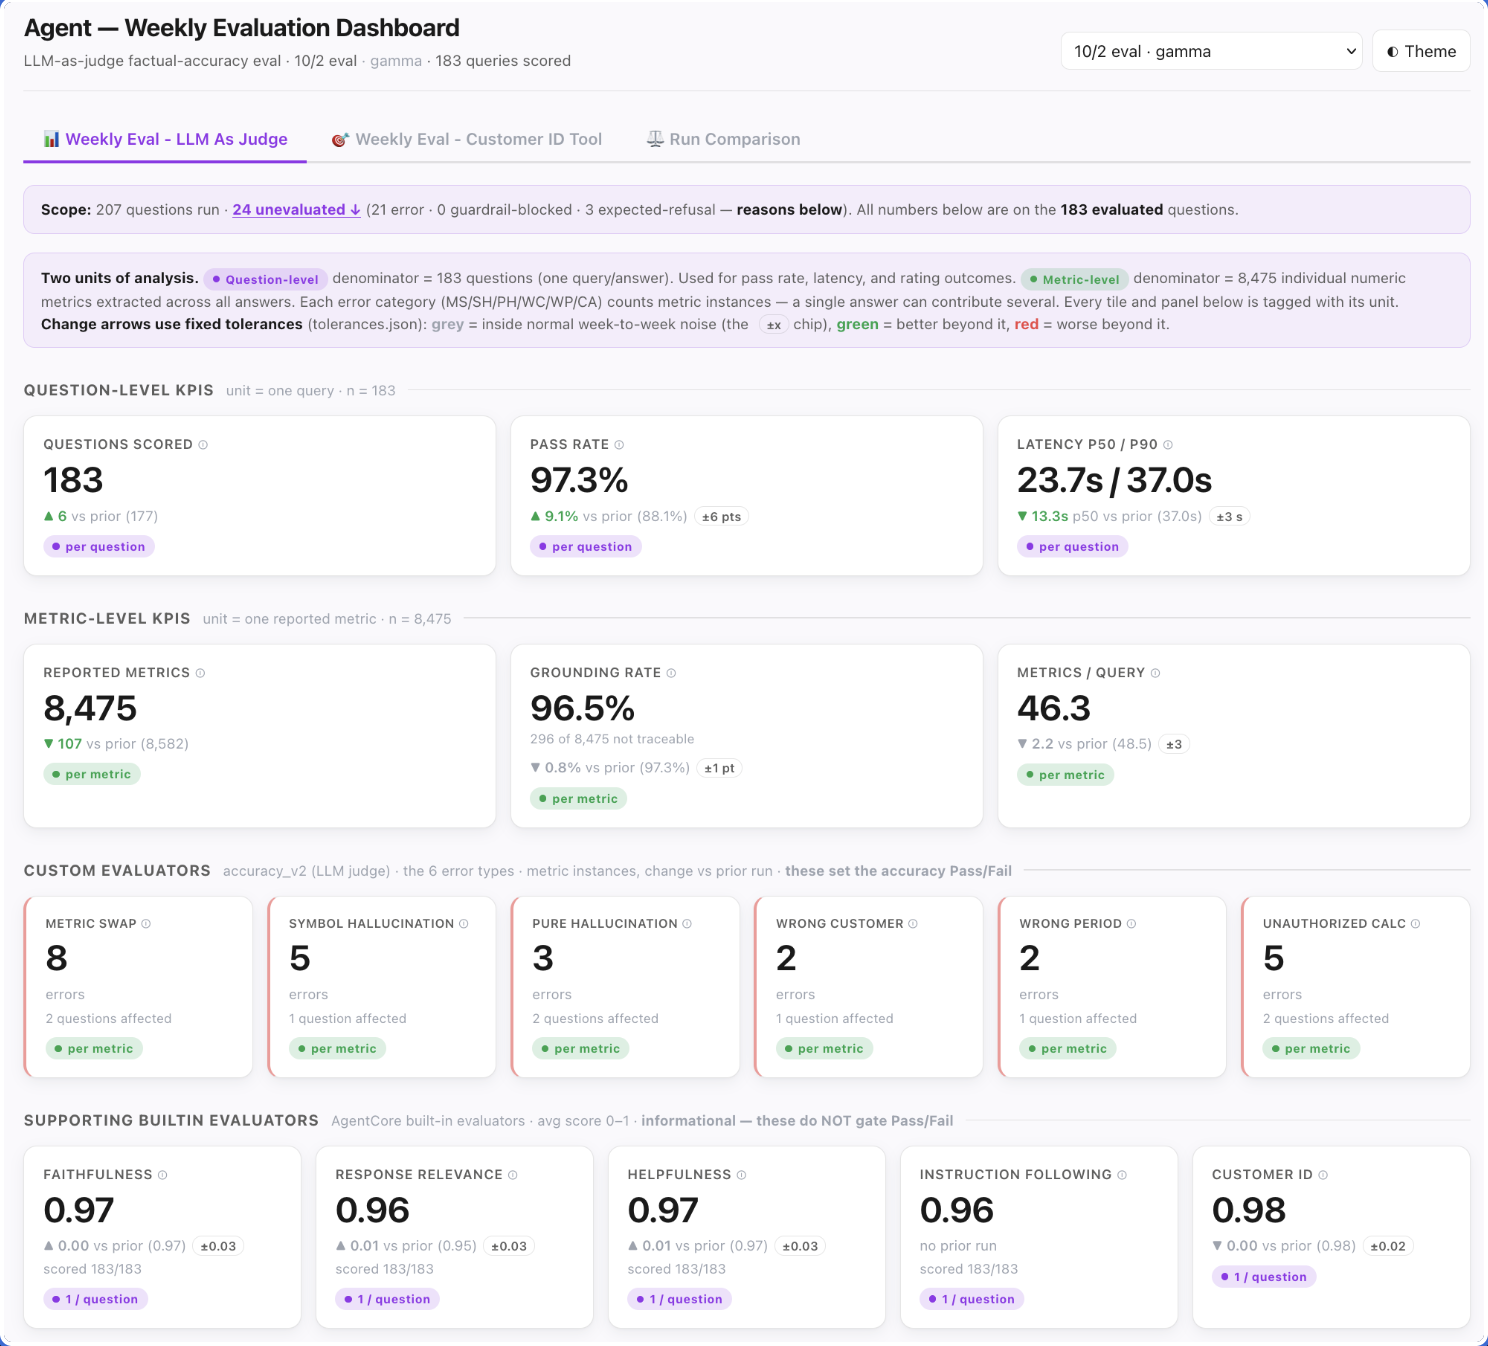
Figure 6: Top-line weekly evaluation dashboard with combined pass rate and latency. The numbers and values in the figure are illustrative.
Figure 7 drills into that same run at the custom-evaluator, failure-category level, breaking down exactly which error types (metric swaps, hallucinations, customer ID misses, and others) are driving the gap and how many questions each one affects. The numbers and values in the figure are illustrative.
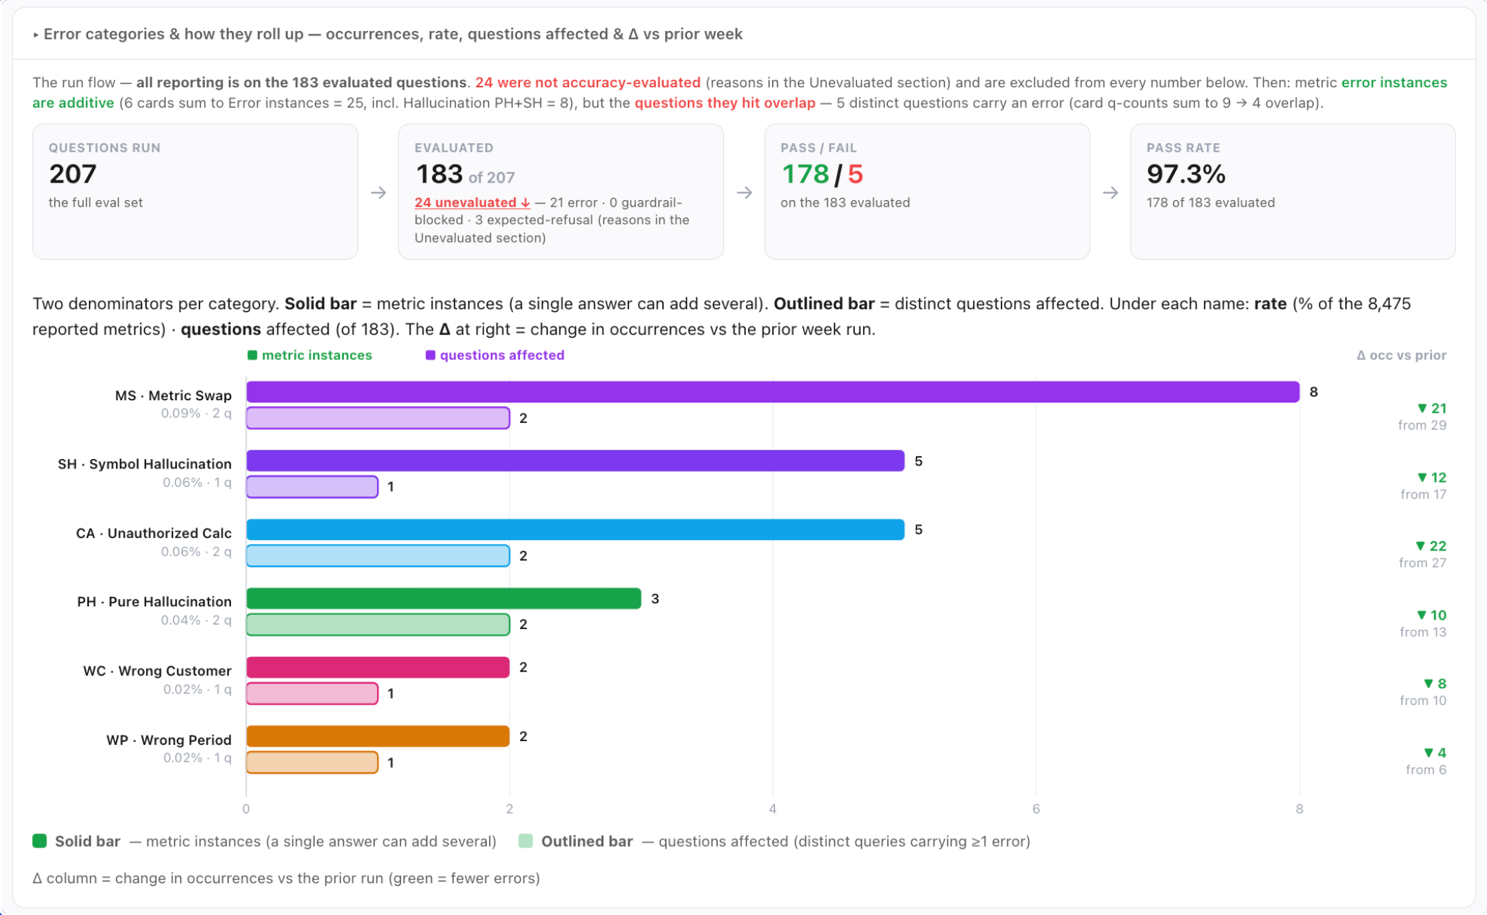
Figure 7: Weekly error-reporting dashboard breaking down failures by category. The numbers and values in the figure are illustrative.
Before Stage 8, mean time to detect (MTTD) was days to weeks. After Stage 8, it is under four hours, and the first signal is a CloudWatch alarm with an AgentCore trace attached.
Stage 9: The Feedback Loop. Continuous improvement
This stage turns observations into actions. The system compounds quality over time. We use AgentCore optimization, a capability of Amazon Bedrock AgentCore, to close the loop.
- System prompt recommendation: Analyzes agent traces and generates a data driven optimized system prompt that improves performance on the target evaluator. The solution uses failure patterns and adds specific behavioral instructions.
- Tool description recommendation: Analyzes agent traces and generates sharpened tool descriptions that reduce tool selection confusion. Particularly when an agent selects the wrong tool for ambiguous requests.
Let’s look at an example:
AgentCore optimization in action
What to improve on:
Target evaluator: hallucination: model reproducing hardcoded values from few-shot examples verbatim in unrelated contexts.Why this happened: Few-shot examples contain real dollar amounts and customer names (for example, “$4.2M”, “Acme Corp”) that the model memorizes and leaks into unrelated queries.
How to fix: Replace hardcoded values in few-shot examples with generic placeholders (for example,
$[AMOUNT],[CUSTOMER_NAME]) so the model learns response structure without memorizing specific data points.Impact and result: Fix applied. Pure hallucination occurrences dropped from 138 to under 52 per 10,000 responses, and overall grounding rate improved from 93 percent to 96 percent.
AgentCore optimization uses recommendations to produce data driven system prompt and tool descriptions changes based on real agent traces and a target evaluator. AgentCore optimization builds on AgentCore Evaluations . Low-scoring traces are promoted into the golden set as permanent regression guards so each failure does not reach users twice.
Agent evaluation key metrics at a glance
The evaluation metrics are defined at Stage 1, enforced across the nine stages, and monitored continuously in production. This set is not static. As we learn from the agent in production, new failure patterns surface, new dimensions become measurable, and the metrics evolve accordingly. What follows is where we started and what we track today.
| Level | Metric | What it measures | Tracked as |
| Quality: Agent | Overall accuracy pass rate | % of responses with zero taxonomy failures | Headline scorecard metric |
| Quality: Agent | Metric swap rate | Correct customer and period, wrong metric returned | Occurrences per 100 responses |
| Quality: Agent | Wrong period rate | Data from the wrong time window | % citing the correct time window |
| Quality: Agent | Wrong customer rate | Conflated account names or subsidiaries | Entity resolution accuracy % |
| Quality: Agent | Grounding rate | Figures traceable to a retrieved source | % of reported figures grounded |
| Quality: Agent | Scope adherence rate | Responses that address the question asked | % on-topic responses |
| Quality: Agent | Unauthorized calculation rate | Unsanctioned derived figures | Occurrences per 100 responses |
| Quality: Agent | Relevance / Faithfulness / Helpfulness | Response quality across AgentCore built-in dimensions | AgentCore built-in evaluator score (0–1) |
| Quality: Tool | Customer identification accuracy | Tool resolves to the exact canonical entity | % correct resolutions (deterministic) |
| Quality: Tool | Tool selection accuracy | Agent selects the correct tool for the query | AgentCore built-in evaluator score (0–1) |
| Quality: Tool | Retrieval precision | Retrieved context contains the information needed | % retrievals with relevant context |
| Quality: Tool | SQL generation accuracy | Data Insights Agent generates correct SQL | % correct result sets (deterministic) |
| Quality: Tool | Tool pass rate | % of tool calls returning a valid response | % success per tool |
| Quality: Multi-agent | End-to-end accuracy pass rate | Full orchestration path produces a correct response | % of scenarios passing all evaluators |
| Quality: Multi-agent | Routing accuracy | Orchestrator routes to the correct sub-agent(s) | % correct routing (deterministic) |
| Quality: Multi-agent | Synthesis faithfulness | Sub-agent outputs combined without distortion | LLM-as-judge score across agent boundaries |
| Quality: Multi-agent | Context propagation accuracy | Context passed between agents is correct and complete | % traces with no context loss |
| Safety | Guardrail block rate | % of requests blocked at input or output | Per 1,000 requests |
| Safety | Input / Output violation rate | % of queries or responses flagged as policy-violating | % of total requests / responses |
| Safety | Guardrail latency | Latency overhead added by guardrail checks | p99 (target: under 50ms) |
| Performance | End-to-end latency | Query received to response delivered | p50, p90, p99 |
| Performance | Per sub-agent / tool latency | Per sub-agent and per tool execution | p50, p90, p99 independently |
| Performance | Latency regression rate | CI runs that breach the Stage 1 latency threshold | % of CI runs |
| Cost | Cost per query | Total token cost per end-to-end user request | Input + output tokens × price |
| Cost | Cost per successful response | Cost per query divided by pass rate | Penalizes costly failures |
| Cost | Avg tool calls per query | Reasoning efficiency. Rising calls signal degradation | Average per query |
| Ops control | MTTD / MTTR | Time to detect and remediate, per failure class | Hours (MTTD target: under 4h) |
| Ops control | Automation detection rate | Incidents detected by evaluation compared to user complaints | % (target: above 95%) |
| Ops control | Alarm false positive rate | Alarms not corresponding to real degradation | % of total alarms |
Conclusion
The impact of the nine-stage agent evaluation framework was concrete and measurable. Quality regressions that previously took days or weeks to surface, and usually arrived through a seller complaint, are now caught in under four hours by automated evaluation. Deployment decisions that once relied on subjective judgment now require every evaluator to pass a quantitative threshold. Prompt iteration cycles fell from days to minutes. Safety moved from periodic audits to 100 percent guardrail coverage on every request. Latency regressions are caught at the CI gate before they reach production. Cost surprises that once appeared weeks later in billing are now evaluated at Stage two and enforced by the quality gate before a change ships. And “something in the agent pipeline” became one click from a CloudWatch alarm to a full agent execution trace with every reasoning step visible.
The broader lesson is one the industry has learned before. DevOps taught us that shipping code without automated testing is reckless. MLOps taught us that deploying models without monitoring is dangerous. AgentOps teaches us the same thing about AI agents: operating them without continuous, multi-level evaluation is flying blind.
The nine-stage framework described here is not specific to sales intelligence agents. Team deploying multi-agent systems that reason, call sub-agents, tools, and synthesize responses will face these same questions across the same lifecycle. Your failure taxonomy will look different. Your golden set will reflect your domain. Your evaluator stack will be tuned to your users. What stays constant is the principle: evaluation is not a final QA step. It is the operating system of the agent itself, continuously measured, automatically defended, and improved with every interaction.
If you are building production agents and want to bring this kind of evaluation discipline to your system, Amazon Bedrock AgentCore Evaluations gives you the platform to do it: on-demand evaluation for experiments, batch evaluation for continuous monitoring, online evaluation for live traffic, built-in and customized evaluators, dataset evaluation(in public preview), CloudWatch integration, and the AgentCore optimization features recommendations and A/B tests to close the feedback loop. Start with Stage one, define what good looks like for your agent, and let the framework do the rest.
Ready to start? See Evaluate agent performance in the Amazon Bedrock AgentCore documentation. And if you’re building production agents and want to talk through how to apply this framework to your system, we’re happy to help. Reach out to us directly or through your AWS account team.
To learn more about Amazon Bedrock AgentCore Evaluations, see Evaluate agent performance in the AWS documentation. For a technical introduction, read Build reliable AI agents with AgentCore Evaluations. To see how we built the Performance Insights Agent, read How AWS SMGS uses an AI-powered conversational assistant to transform business management with Amazon Bedrock AgentCore. To learn about AgentCore recommendation and optimization, read AgentCore optimization: Improve agent quality loop with recommendations and A/B tests
Acknowledgement
We extend our sincere gratitude to our executive sponsors and mentors whose vision and guidance made this initiative possible: Damien Forthomme, Manager III, Applied Science; Akhand Singh, Head of Data Engineering; Sujit Narapareddy, Director AWS Insights; Monica Jain, Sr. Product Manager – Tech and Norman Braddock, Senior Manager of AI Product Management at AWS; Muhammad Umar Javed, Applied Scientist III, L6.
About the authors

Rui Li
Rui is an Applied Scientist in AWS Sales, Marketing, and Global Services (SMGS). She leads the science behind making AI agents trustworthy, so AWS sellers, leaders and customers can rely on them with confidence. Her work compares agent evaluation approaches and optimization methods, and turns them into a scalable, reusable evaluation framework for responsible multi-agent AI in production. Teams across AWS can adopt it to check agent quality from start to finish, ship updates with confidence, and catch problems before customers notice. By linking evaluation to continuous improvement, her work makes AWS AI agents more accurate and dependable over time, and builds customer trust in AWS as the platform for production-grade agentic AI.

Chandana Srinivas
Chandana is a Senior Product Manager in AWS Sales, Marketing, and Global Services (SMGS). She leads the strategy and delivery of agentic AI products that give AWS sellers and leaders trusted customer intelligence at scale. Her portfolio includes customer intelligence agents built on knowledge graphs and natural-language query systems. She also drives the agent evaluation strategy for these products.

Mihir Gadgil
Mihir is a Senior Data Engineer in AWS Sales, Marketing, and Global Services (SMGS), specializing in enterprise-scale data solutions and generative AI applications. With over 9 years of experience and a Master’s in Information Technology & Management, he focuses on building robust data pipelines, complex data modeling, and ETL/ELT processes. His expertise drives business transformation through innovative data engineering solutions and advanced analytics capabilities.

Alok Singh
Alok is a Senior Software Development Engineer at AWS, specializing in building scalable infrastructure, web services, and AI/ML solutions. With over 12+ years of experience, he has architected production-grade systems including an end-to-end ML platform on Amazon SageMaker that enables data scientists to deploy models to production within a week, agentic AI solutions for AWS sales teams, and a high-scale billing system processing billions of events for AWS customers worldwide. His expertise spans distributed systems, cloud architecture, and generative AI, with a focus on delivering measurable business impact through innovative engineering solutions.

Madhu Samhitha Vangara
Madhu is a Worldwide Generative AI Specialist Solution Architect at AWS, focusing on agentic AI go-to-market for Amazon Bedrock AgentCore and Strands Agents. She brings a deep understanding of enterprise business value, with previous industry experience at Juniper Networks, VMware, Barclays, and IGCAR. She translates emerging AI capabilities and research into measurable outcomes for customers. She is a speaker at AI conferences such as AWS re:Invent, NVIDIA GTC, and AI Summit, where she specializes in agent optimization, agentic workloads , partner network, and production-grade agentic AI. She holds a master’s in computer science from UMass Amherst. Outside work, she’s a trained Indian classical dancer and an art enthusiast.

Bharathi Srinivasan
Bharathi is a Senior Generative AI Data Scientist at AWS. Bharathi works with enterprise customers on large‑scale generative AI challenges, including robustness and verification of non‑deterministic systems, governance of GenAI and agentic AI platforms, and the quality of dynamic agentic AI systems.
來源:AWS Machine Learning Blog · aws.amazon.com